Complete
the following steps to create a VI that generates, analyzes, and
displays
a signal.
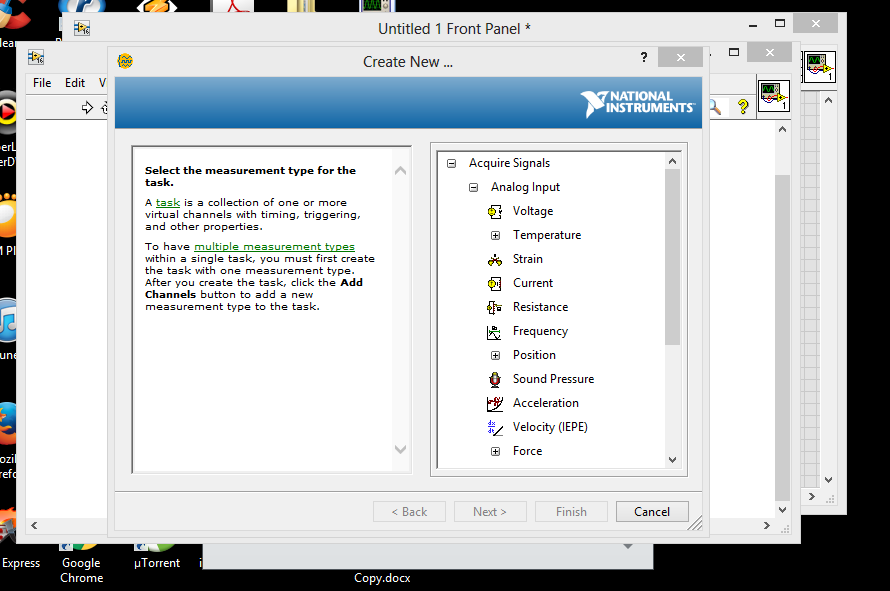
1. In the Getting Started window, click New to display the New dialog
box.
2. From the Create New list,
select VI»From Template»Tutorial
(Getting Started)»Generate, Analyze, and Display. This template
VI simulates a signal
and analyzes it for its root mean square (RMS)
3. Click the OK button or
double-click the name of the template to create
a VI
from the template.
4. If the Context Help window is not visible, press the <Ctrl-H> keys to
display
the window. (Mac OS X) Press the <Command-Shift-H> keys.
5.
Display the block diagram by pressing the <Ctrl-E> keys.
6.
Move the cursor over the Amplitude and Level Measurements Express
VI,
shown at left.
The Context Help window displays
information about the behavior of
the
Express VI.
Keep
the Context Help window open. It will provide useful
information
as you complete the rest of this exercise.
7.
Display the front panel and remove the RMS indicator, shown at left.
You
will not use the RMS functionality of the Amplitude and Level
Measurements
Express VI for this exercise. However, you can use the
Generate,
Analyze, and Display template VI with the RMS
functionality
in the future to reduce development time.
8.
Display the block diagram and remove any broken wires that result
from
removing the RMS indicator.
To remove all broken wires from
the
block diagram, you can press the <Ctrl-B> keys.
9.
Then return to the front panel window and right-click the waveform
graph
indicator. Select Properties from
the shortcut menu. The Graph
Properties dialog box appears.
10.
On the Appearance page,
place a checkmark in the Visible checkbox
in
the Label section and
enter Unfiltered Signal in the text box.
11.
Click the OK button to
save the configuration and close the Graph
Properties dialog box.
12.
Run the VI.
The
signal appears in the graph.
13. Click the STOP button
to stop the VI.
ADDING A SIGNAL
The
Simulate Signal Express VI simulates a sine wave by default. You can
customize
the simulated signal by changing the options in the Configure
Simulate Signal dialog box.
Complete
the following steps to create an additional simulated signal that
adds
uniform white noise to the sine wave.
1.
On the block diagram, use the Positioning tool to select the Simulate
Signal
Express VI.
Hold
down the <Ctrl> key and click and drag to create an additional
Simulate
Signal Express VI on the block diagram. (Mac
OS X) Hold
down
the <Option> key and drag. (Linux)
You also can hold down the
middle
mouse button and drag.
2.
Release the mouse button to place the copied Simulate Signal Express
VI
below the original Simulate Signal Express VI. LabVIEW updates
the
name of the copied Simulate Signal Express VI to Simulate
Signal2.
3.
Double-click the Simulate Signal2 Express VI to display the
Configure Simulate Signal dialog box.
4.
Select Sine from the Signal type pull-down menu.
5.
Enter 60 in the Frequency (Hz)
text box.
6.
Enter 0.1 in the Amplitude text box.
7.
Place a checkmark in the Add noise checkbox to add noise to the sine
signal.
8.
Select Uniform White Noise from the Noise type pull-down
menu.
9.
Enter 0.1 in the Noise
amplitude text box.
10.
Enter -1 in the Seed number text box.
11.
In the Timing section,
select the Run as fast as possible option.
12.
In the Signal Name section,
remove the checkmark from the Use
signal type name checkbox.
13.
Enter 60 Hz and Noise in the Signal name text box.
When you change the signal name in the Configure
Simulate Signal
dialog box, LabVIEW changes the name of the signal output on
the
block diagram. Changing the signal name makes it easier for
you to
identify the signal type when you view the Express VI on the
block
diagram.
14. Click the OK button to save the current
configuration and close
the Configure Simulate Signal dialog box
ADDING TWO SIGNAL
To
add two signals together to create one signal, you can use the Formula Express
VI. Rather than merging two signals on one graph, the Formula Express
VI adds both signals together to create a single signal on the graph. You can use this
Express VI to add noise to a signal.
Complete
the following steps to add the 60 Hz and
Noise signal to the Sine signal.
1. In
the block diagram window, triple-click the wire that connects the
Sine output of the Simulate Signal Express VI to
the Signals input
of
the
Amplitude and Level Measurements Express VI and to the
Unfiltered Signal indicator.
Remove the wire.
2.
On the Functions palette,
click the Search button to
search for the
Formula
Express VI, shown at left, and add it to the block diagram
between
the Simulate Signal Express VIs and the Amplitude and Level
Measurements
Express VI. The Configure Formula dialog box
appears.
Note LabVIEW displays a folder glyph to the left of subpalettes in the
search results and
displays
a light blue glyph to the left of Express VIs in the search results.
3.
In the Label column,
change the label for X1 to Sine and the label for
X2 to 60 Hz and Noise.
The
Formula Express VI automatically enters the first input, Sine, in
the Formula text box.
4.
Click the + button and
then the X2 button to
add Sine and 60 Hz and
Noise together in the Formula text box.
5.
Click the OK button to
save the current configuration and close the
Configure Formula dialog box.
6.
Use the Wiring tool to wire the Sine output of the Simulate Signal
Express
VI to the Sine input of
the Formula Express VI.
7.
Wire the 60 Hz and Noise output of the Simulate Signal 2 Express VI
to
the 60 Hz and Noise input of the Formula Express VI.
8.
Wire the Result output of
the Formula Express VI to the Unfiltered
Signal indicator and to the Signals input of the Amplitude and Level
Measurements
Express VI.
9.
Display the front panel by pressing the <Ctrl-E> keys.
10.
Run the VI.
The
signal with added noise appears in the graph.
11.
Click the STOP button to
stop the VI.
12.
Select File>>Save As and save the VI as Analysis.vi in an easily
accessible location.
FILTERING SIGNAL
You can
use the Filter Express VI to process signals through filters and
windows.
Complete
the following steps to configure the Filter Express VI to filter the
signal
using an infinite impulse response (IIR) filter.
1.
Display the block diagram window and remove the wire that connects
the Result output of the Formula Express VI to the Signals input of the
Amplitude
and Level Measurements Express VI.
2.
Remove all broken wires that result from removing the wire.
3.
Search for the Filter Express VI, shown at left, and add it to the block
diagram
between the Simulate Signal2 Express VI and the Amplitude
and
Level Measurements Express VI. The Configure
Filter dialog
box
appears.
4.
In the Filter Specifications section, change the Cutoff
Frequency (Hz) to 25.
5.
Click the OK button to
save the configuration and close the Configure
Filter dialog box.
6.
Display the front panel.
7.
Click the Unfiltered Signal waveform graph indicator and press the
<Ctrl>
key while you drag with the Positioning tool to create an
additional
waveform graph indicator.
8.
Triple-click the Unfiltered Signal 2 label above the new waveform
graph
indicator and enter Filtered Signal to
change the label of
the
indicator. You also can change the label on the Appearance page
of
the Graph Properties dialog box.
9.
On the block diagram, wire the Result output of the Formula Express
VI
to the Signal input of
the Filter Express VI and to the Unfiltered
Signal waveform graph indicator.
10.
Wire the Filtered Signal output of the Filter Express VI to the Signals
input
of the Amplitude and Level Measurements Express VI aand to the
input of the Filtered Signal waveform graph indicator.
11.
Select File >> Save.
The block diagram of the Analysis VI should appear similar to Figure 3-3.
MODIFYING THE APPEARANCE OF GRAPH
You
can use the Display Format page of the Graph Properties dialog box to
specify how the scales of the x-axis and y-axis appear on the graph. Complete
the following steps to change the format of the x-axis and y-axis of
the Unfiltered Signal and Filtered Signal graphs.
1.
In the front panel window, right-click the Unfiltered
Signal graph indicator
and select Properties from
the shortcut menu. The Graph Properties dialog box appears.
2.
On the Display Format page, select Time (X-Axis) from the top pull-down
menu.
3.
Select the Default editing mode option.
4.
In the Type list,
select Automatic formatting.
5.
In the Digits field,
enter 6 and select Significant
digits from the Precision Type pull-down menu.
6.
Place a checkmark in the Hide trailing zeros checkbox.
7.
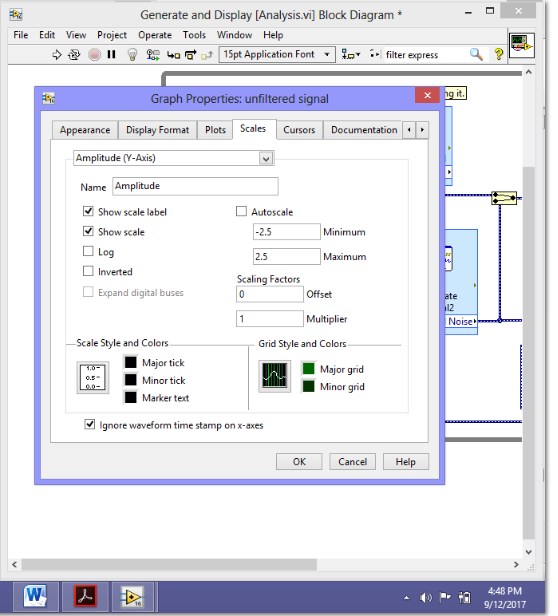
Select Amplitude (Y-Axis) from the top pull-down menu and repeat steps
3–6 so the y-axis configuration matches the x-axis configuration.
8. On the Scales page, select Amplitude (Y-Axis).
9. Remove the checkmark
from the Autoscale checkbox.
10.
Enter -2.5 in the Minimum text box and 2.5 in the Maximum text
box.
11.
Click the OK button to
save the configuration and close the Graph
Properties dialog box.
12.
Repeat steps 1–11 to configure the Filtered
Signal graph indicator.
The
x-axis and the y-axis on the Unfiltered
Signal and Filtered
Signal graph indicators change to
reflect the new configuration
ANALYZING THE AMPLITUDE OF A SIGNAL
You
can use the Amplitude and Level Measurements Express VI to analyze the
voltage characteristics of a signal. Complete
the following steps to reconfigure the Express VI to measure the
peak-to-peak
amplitude values of the signal.
1.
On the block diagram, double-click the Amplitude and Level
Measurements
Express VI to display the Configure
Amplitude and
Level Measurements dialog
box.
2.
In the Amplitude
Measurements section, remove the checkmark
from
the RMS checkbox.
3.
Place a checkmark in the Peak to peak checkbox. Peak to peak
appears
in the Results section with the corresponding value of the
measurement.

4.
Click the OK button to
save the current configuration and close
the Configure Amplitude and Level Measurements dialog box.
The RMS output of the Amplitude and Level
Measurements Express
VI
changes to reflect the new Peak to Peak output, shown at left.
You
will use the Peak to Peak output in a later exercise.
CONTROLLING THE SPEED OF EXECUTION
To
plot the points on the waveform graphs more slowly, you can add a time
delay
to the block diagram. A time delay slows the speed at which a VI
runs.
Complete
the following steps to control the speed at which the VI runs.
1.
On the block diagram, search for the Time Delay Express VI.
2.
Place the Time Delay Express VI inside the While Loop. The
Configure Time Delay dialog box
appears.
3.
Enter 1.000 in the Time delay
(seconds) text box and click the OK
Button
4.
Display the front panel and run the VI. The VI runs more slowly.
The
loop iterates once every second.
5.
Stop the VI.
Another
way to control the speed of the VI is to alter the rate of data acquisition.
On the block diagram, double click the Simulate
Signal Express
VI to display the Configure Simulate Signal dialog box. Locate
the Timing section in
the dialog box. The Timing section contains
a number of ways to alter the rate of data acquisition and the speed
at which a VI runs. For
example, one of the default settings of the VI is Simulate Acquisition Timing. This
means that the VI mimics the acquisition rate
of a hardware device. You can select Run as fast
as possible to display
data more quickly. In the Samples per second (Hz) text box, the
default value is 1000, while the default value in the Number of Samples text box is 100. This means that the VI will
output 100 data
points
spanning 0.1 second. You can change these values to change the amount
of data the VI displays, as well as the rate at which the VI displays the data.
ADDING A WARNING LIGHT
If
you want a visual cue to indicate when a value exceeds a specified limit,
you
can use a warning light.
Complete
the following steps to add a warning light to the VI.
1.
Display the Controls palette
by right-clicking any blank space in the
front
panel window.
2.
On the Express palette,
select the LEDs palette.
3.
Select the round LED indicator and add it to the front panel to the left
of
the waveform graphs.
4.
Double-click the Boolean label
above the LED and enter Warning to
change
the label of the LED.
You
will use this LED in a later exercise to indicate when a value has
exceeded
its limit.
5.
Select File»Save As to display the Save As dialog box.
6.
Read the various dialog box options. Select the Copy and Substitute
copy for original options to create
a copy of the original VI and
immediately
edit the copy.
7.
Click the Continue button
and save the VI as Warning Light.vi in
an easily accessible
location.
SETTING A WARNING LEVEL LIMIT
To
specify the value at which you want the LED to light, use the Comparison
Express VI.
Complete
the following steps to compare the peak-to-peak value to a limit you
set.
1.
On the block diagram, search for the Comparison Express VI and place it
to the right of the Amplitude and Level Measurements Express VI. The Configure Comparison dialog box appears.
2.
In the Compare Condition section, select the > Greater option.
3.
In the Comparison Inputs section, select Value and enter 2 in the Value numeric control to assign a constant value at
which you want the LED
to light.
4.
Click the OK button to
save the current configuration and close the Configure Comparison dialog box. The
name of the Comparison Express VI changes to reflect the operation
of the Express VI, shown at left. Greater indicates that the Express
VI does a greater than comparison.
5.
Wire the Peak to Peak output of the Amplitude and Level Measurements
Express VI to the Operand 1 input
of the Greater Express
VI.
6.
Move the cursor over the wire that connects the Peak to Peak output to
the Operand 1 input.
7.
When the Positioning tool appears, right-click the wire that connects
the Peak to Peak output to the Operand 1 input and select Create»
Numeric Indicator from the
shortcut menu.
A Peak to Peak terminal, shown at
left, appears on the block diagram. If
the Peak to Peak terminal appears to be on top of the wires between the
Express VIs, move the Express VIs and Peak to Peak terminal around
to create more space. For example, move the Peak
to Peak terminal
into blank space above the Express VIs.
WARNING THE USER
After
you specify the values at which you want the LED to light, you must
wire
the LED to the Greater Express VI.
Complete
the following steps to provide a visual cue when the peak-to-peak
value
of the signal exceeds a specified limit.
1.
In the block diagram window, move the Warning terminal to the right of
the Greater Express VI. Make sure the Warning terminal is inside the
While Loop, as shown in Figure 3-4.
2.
Wire the Result output of
the Greater Express VI to the Warning terminal.
3.
Display the front panel. A
numeric indicator labeled Peak to Peak appears in the front panel
window.
This indicator displays the peak-to-peak value of the signal.
4.
Run the VI. When
the peak-to-peak value exceeds 2.0, the Warning indicator lights.
5.
Click the STOP button to
stop the VI.
6.
Save the VI.
CONFIGURING A VI TO SAVE DATA TO A FILE
To
store information about the data a VI generates, use the Write To Measurement
File Express VI.
Complete
the following steps to build a VI that saves peak-to-peak values and
other information to a LabVIEW data file.
1.
Search for the Write To Measurement File Express VI and add it to the block
diagram below and to the right of the Amplitude and Level Measurements
Express VI.
The Configure Write To Measurement File dialog box appears. The Filename text box displays the full path to the output
file, test.lvm. A .lvm file is a
tab-delimited text measurement file you
can
open with a spreadsheet application or a text-editing application. LabVIEW
saves data with up to six digits of precision in a .lvm file.
LabVIEW saves the .lvm file in the
default LabVIEW Data
directory.
LabVIEW installs the LabVIEW Data directory
in the default
file directory of the operating system. When
you want to view the data, use the file path displayed in the Filename text box to access the test.lvm
file.
2.
In the Configure Write to Measurement File dialog box, locate the If a file already exists section and
select the Append to file option to write
all the data to the test.lvm file
without erasing any existing data
in the file.
3.
In the Segment Headers section, select the One header
only option
to
create only one header in the file to which LabVIEW writes the data.
4.
Enter the following text in the File Description
text box: Sample of peak to peak values. LabVIEW appends the text you enter in this text
box to the header of the file.
5.
Click the OK button to
save the current configuration and close the
Configure Write To Measurement File dialog box.
SAVING THE DATA TO A FILE
When
you run the VI, LabVIEW saves the data to the test.lvm file. Complete
the following steps to generate the test.lvm file.
1.
On the block diagram, wire the Peak to Peak output of the Amplitude and
Level Measurements Express VI to the Signals input of the Write To
Measurement File Express VI.
2.
Select File»Save As and save the VI as Save Data.vi in an easily accessible
location.
3.
Display the front panel and run the VI.
4.
Click the front panel STOP button.
5.
To view the data you saved, open the test.lvm file in the LabVIEW Data directory with a spreadsheet or text-editing application. The
file has a header that contains information about the Express VI.
6.
Close the file after you finish looking at it and return to the Save Data VI.
ADDING A BUTTON THAT STORES DATA WHEN CLICKED
If
you want to store only certain data points, you can configure the Write To
Measurement File Express VI to save peak-to-peak values only when a user
clicks a button. Complete
the following steps to add a button to the VI and configure how the
button responds when a user clicks it.
1.
Display the front panel and search the Controls palette for a rocker button.
Select one of the rocker buttons and place it to the right of the waveform
graphs.
2.
Right-click the rocker button and select Properties from the shortcut menu
to display the Boolean Properties dialog box.
3.
Change the label of the button to Write to File.
4.
On the Operation page
of the Boolean Properties dialog box, select Latch when pressed from the Button behavior list. Use
the Operation page
to specify how a button behaves when a user
clicks
it. To see how the button reacts to a click, click the button in the Preview Selected Behavior section.
5.
Click the OK button to
save the current configuration and close the Boolean Properties dialog box.
6.
Save the VI.
SAVING DATA WHEN PROMPTED BY A USER
Complete
the following steps to build a VI that logs data to a file when the user
clicks a button on the front panel.
1.
In the block diagram window, double-click the Write To Measurement File
Express VI to display the Configure Write To
Measurement File dialog box.
2.
Change the filename test.lvm in the Filename text box to Selected Samples.lvm to save the data to a different file.
3.
Click the OK button to
save the current configuration and close the Configure Write To Measurement File dialog box.
4.
Right-click the Signals input
of the Write To Measurement File Express
VI and select Insert Input/Output from the shortcut menu to
insert
the Comment input.
5.
Right-click the Comment input
of the Write To Measurement File Express
VI and select Select Input/Output»Enable from the shortcut menu
to replace the Comment input
with the Enable input.
The
inputs and outputs of an Express VI appear in a predetermined order
when you add new inputs and outputs. To select a specific input, you
might need to add an input first, and then change the input to the specific
one you want to use by right-clicking the input and selecting Select Input/Output from the
shortcut menu.
6.
Move the Write to File terminal to the left of the Write To
Measurement
File Express VI.
7.
Wire the Write to File terminal to the Enable input of the Write To
Measurement
File Express VI.
VIEWING SAVED DATA
Complete
the following steps to view the data that you save to the Selected Samples.lvm file.
1.
Display the front panel and run the VI. Click the Write to File button
several
times.
2.
Click the STOP button.
3.
Open the Selected Samples.lvm file with a spreadsheet
or text-editing
application.
The Selected
Samples.lvm file differs from the test.lvm
file. test.lvm recorded all the data generated by the Save Data VI, whereas
Selected Samples.lvm recorded data only when
you clicked
the Write to File button.
4.
Close the file after you finish looking at it.
5.
Save and close the VI.