Friday, 15 September 2017

CHAPTER 2 : CUSTOMIZING A VI

Okay guys this will be the next things after we try out the 'GETTING STARTED TO LAB VIEW'


OPEN A BLANK VI

First we start with blank VI. So next add VIs Expression to complete the specific task.


Getting started >> blank VI in the New section.

Blank front panel window and block diagram window appear.
Function palette not visible? then, right click any blank space on the block diagram to display Function Palette.

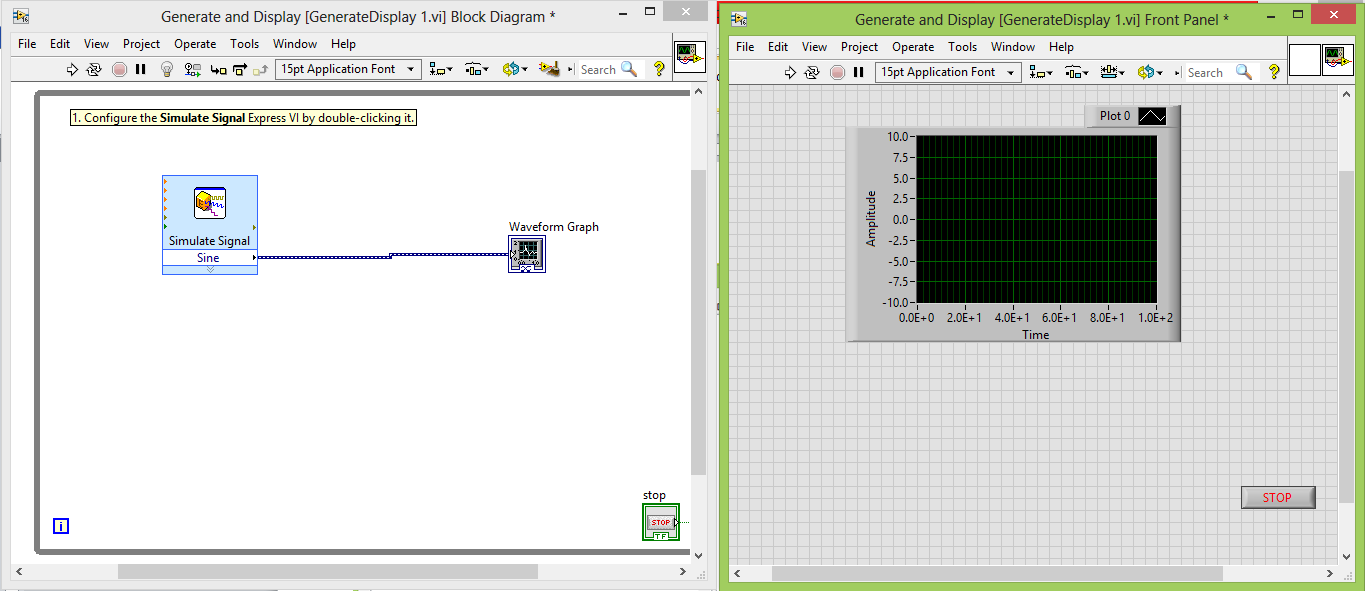
ADDING AN EXPRESS VI THAT SIMULATES A SIGNAL 

To open context help

Help >> Show context help (from the blog diagram and front panel)


On the Function Palette >> Express >> Input Palette. Then move the cursor over one of the input palette. When you move the cursor over a VI, the Context Help window displays information about that VI.

Use the information that appears in the Context Help window to find the Express VI that can simulate a sine wave signal.

Select Express VI > Configure Stimulate Signal ( dialog box appear).

Move the cursor over the various option in the “Configure Stimulate Signal”


The dialog box will appear. Frequency and Amplitude will appear. Read the information that appears in the context help windows.


Generate a sine wave with frequency = 10.7 and amplitude =2.
The signal in the Result Preview window changes to reflect the configured sine wave.
 
Click the OK button to save the current configuration and close the Configure Simulate Signal dialog box.


Move the cursor over the stimulate signal express VI and read the information that appears in the context help window it will display the addition standard context help description. And then save the VI.


SEARCHING THE HELP AND MODIFYING SIGNAL 

On the block diagram, move the cursor over the stimulate signal express vi to display the context help >> detailed help link to display the stimulate signal topic in the Labview help.


Search tab >> sample compression >> enter >> double click 


add to the block diagram >> move the cursor to block diagram >> add sample compression express VI to the block diagram


Use View >>Quick drop ( find easily the item) >> configure the sample compression expres VI to reduce the signal by a factor 25 using the mean of these values >> ok >>close the configure sample compression dialog box.


Use the Wiring tool to wire the Sine output of the Simulate Signal Express VI to the Signals input of the Sample Compression Express VI.


CUSTOMIZING A USER INTERFACE FROM THE BLOCK DIAGRAM 

Right click the Mean o/p of sample, then Create >> Numeric Indicator >> mean indicator appear shown at left.

Right-click the wire that connects the Sine output of the Simulate Signal Express VI to the Signals input of the Sample Compression Express VI and select Create>>Graph Indicator from the shortcut menu.
Use the Wiring tool to wire the Mean output of the Sample Compression Express VI to the Sine graph indicator.

The merge signals function will appears.


Rearrange the object > display the front panel


CONFIGURING A VI TO RUN CONTINUOUSLY UNTIL THE USER UNTIL THE USER STOP IT 

Add while loop >> execution control >> move the cursor to the upper left corner of the block diagram and drag the cursor diagonally to enclose all the express VIs  >> release the while loop>> stop button will appear 


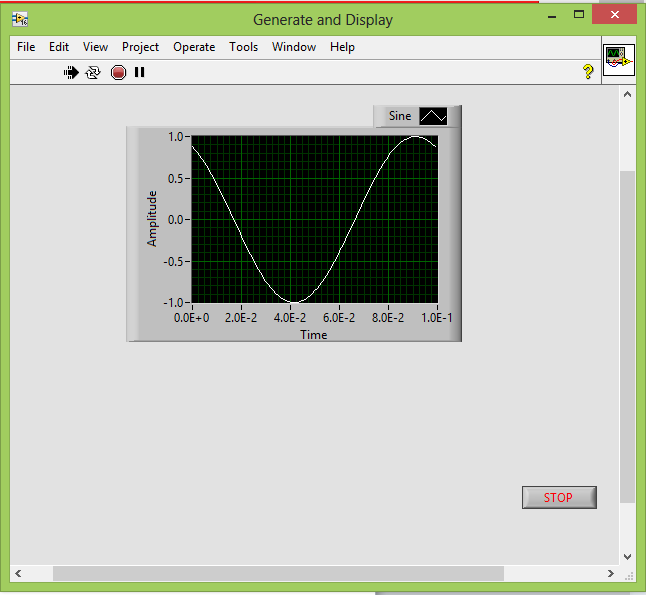
DISPLAY THE FRONT PANEL AND RUN THE VI 


The VI now runs until you click the STOP button. A While Loop executes the VIs and functions inside the loop until the user clicks the STOP button.


Click the STOP button and save the VI.


USING THE ERROR LIST WINDOW 

Display front panel >> Click mean indicator >> shown at left >> press delete key >> display block diagram .

A wire appears as a dashed black line with a red X in the middle, shown at left. The dashed black line is a broken wire. The Run button, shown at left, appears broken to indicate the VI cannot run.


Click broken run >> display error list window >> in the error and warnings list >> select the  wire has loose ends error >> click help


Select view >> error list >> click close button to close the error list window >> run button no longer appears broken.


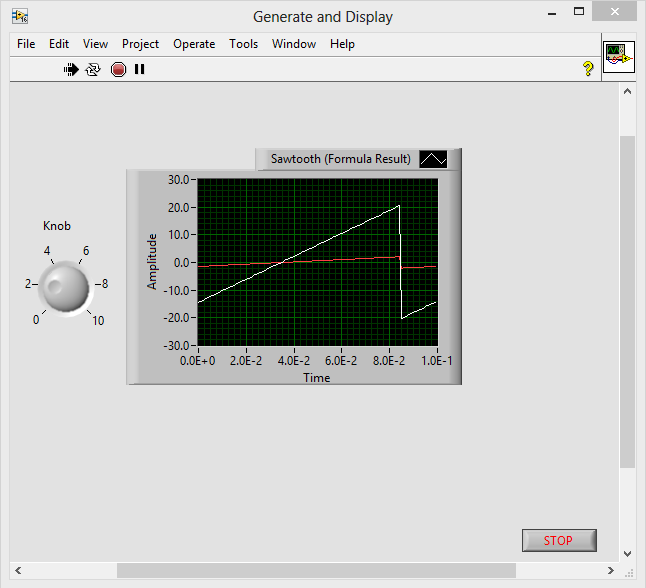
CONTROLLING THE SPEED OF EXECUTION 

On the block diagram, search for the Time Delay Express VI, shown at left, on the Functions palette and place it inside the While Loop. You can use the Time Delay Express VI to control the execution rate of the VI.

Enter 0.25 >> time delay text box >> click ok >> close the configuration time delay dialog box


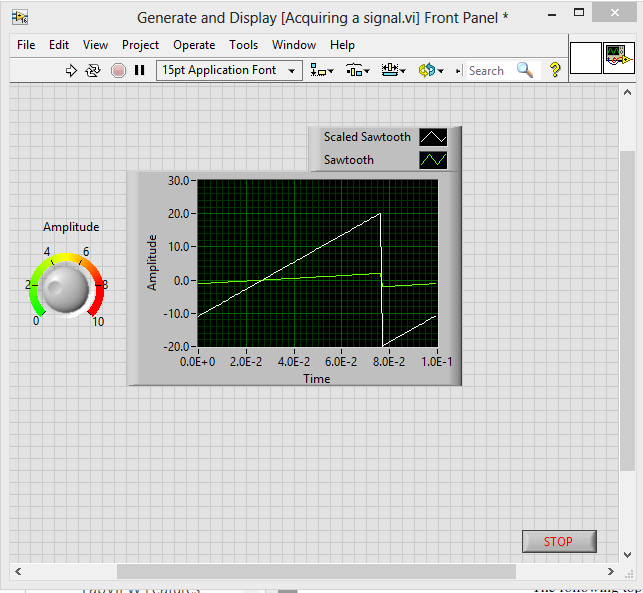
Display the front panel >> and run the VI>> click enable switch and examine the graph
(if the enable switch is on = the graph display reduced the signals. If the enable switch off = graph does not display the reduced signal )


Click stop button to stop the VI


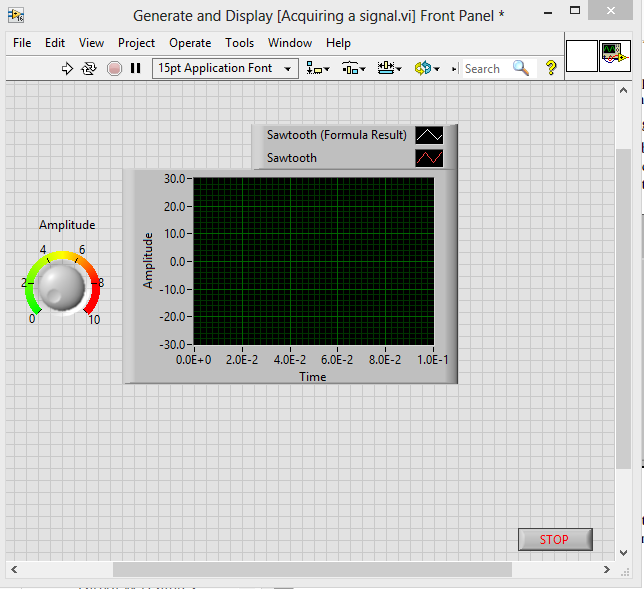
USING A TABLE TO DISPLAY DATA 

Control >> search for Express Table indicator >> add to the right waveform graph.


Display the block diagram and then lab view wired the table terminal to the build table express VI. Drag the cursor diagonally until the selection rectangle encloses the build table express VI and table terminal.

Drag the object into the while loop to the right sample compression Express VI.
Use the Wiring tool to wire the Mean output of the Sample Compression Express VI to the Signals input of the Build Table Express VI.


Display the front panel >> arrange the controls indicator >> run VI >> click enable switch  >> stop VI 
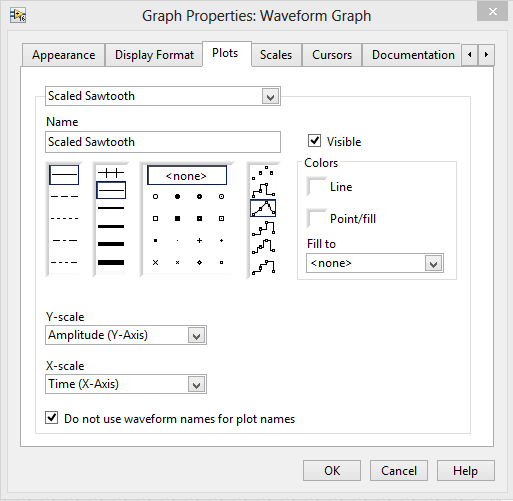


Experiment with properties of the table by using the Table Properties dialog box. For example, try changing the number of columns to one.  Save and close the VI.


to be continued ...


Wednesday, 6 September 2017

CHAPTER 1: GETTING STARTED WITH LAB VIEW

CHAPTER 1


1. Launch Lab View

Next is OPENING A NEW VI FROM THE TEMPLATE

File >> New >> VI

Select General and Display >> OK


Front Panel and Block Diagram will appear like pic below 


At the Front Panel, click the Run button and the sine wave will appear at the front panel. The wave is running and while to stop it just click the Stop button. 


Now we want to ADD A CONTROL TO THE FRONT PANEL  

At the Front Panel click View >> Control Palette 


control palette will appear like this 

At the Control Palette,
Choose Express >> Numeric Control >> Knob  

So move the knob here to the Front Panel next to the waveform graph.


Like this

so after finish we can save the project that we have create above. Just click save as, and select destination.

Next......

CHANGING A SIGNAL TYPE 

On the Block Diagram, right click Simulate Signal >> Properties >> Signal Type >> Saw Tooth >> OK

Next we move to the block diagram, Move the cursor over the down arrows at the bottom of the Simulate Signal Express VI, click and drag the border of the Express VI to add two rows. When we release the border, the Amplitude box input appears.


WIRING OBJECT ON THE BLOCK DIAGRAM

Okay now we move to how to make wiring on the block diagram.. 

Move the cursor over the arrow on the Knob terminal. The cursor becomes a wire spool. When the Wiring tool appears, click the arrow on the Knob terminal and then click the arrow on the Amplitude input of the Simulate Signal Express VI, to wire up the two objects together.


RUNNING A VI 

Front panel >> Run >> move the cursor at the knob ( where the cursor will become a hand or the name is Operating  Tool that will be shown at the left ). Use the Operating tool to change the value of the control.


MODIFYING A SIGNAL 

Go to Block diagram >> click the wire that connect the Simulate Signal Express VI to the Waveform Graph terminal >> delete key


Next, right click to open the function palette  

Function palette  >>Express >> Arithmetic & Comparison >> drag to block diagram between Simulate Signal Express VI and the Waveform Graph terminal 


Configure formula dialog >> help 


Change the text in the Label column of the dialog box option you read about, from X1 to Sawtooth. When you click in the Formula text box at the top of the Configure Formula dialog box, the text changes to match the label you entered. 


entering *10 after Sawtooth in the Formula text box >> OK


Click output of the Simulate Signal Express VI, When the Wiring tool appears, click the arrow on the Sawtooth output and then click the arrow on the Sawtooth input of the Formula Express VI  to wire the two objects together.


Use the Wiring tool to wire the Result output of the Formula Express VI to the Waveform Graph terminal >> Save


DISPLAYING TWO SIGNALS ON A GRAPH


So from this task we go to the block diagram, move the cursor over the arrow on the Sawtooth
output of the Simulate Signal Express VI. Next, Use the Wiring tool to wire the Sawtooth output to the Waveform

Graph terminal.


and then File >> Save


Return to the front panel, run the VI, and turn the knob control. The graph plots the original sawtooth wave and the scaled sawtooth wave with 10 times the amplitude, as we specified in the Formula
Express VI. The maximum value on the y-axis automatically scales as you turn the knob.


At knob 2 graph display original and scaled  sawtooth wave within ten which is 20 as 2 x 10 = 20.  Click the STOP button to stop the VI.


CUSTOMIZING A KNOB CONTROL

Right-click the front panel knob and select Properties from the shortcut menu to display the Knob Properties dialog box. Click the Appearance tab to display the Appearance page. In the Label section on the Appearance page, delete the label Knoband enter Amplitude in the text box.


Click the Scale tab. In the Scale Style section, place a checkmark in the Show color ramp checkbox.
The knob in the front panel window updates to reflect these changes. Click the OK button to save the current configuration and close the Knob Properties dialog box. Save the VI. 


CUSTOMIZING A WAVEFORM GRAPH 

In the front panel window, move the cursor over the top of the plot legend on the waveform graph.
Though the graph has two plots, the plot legend displays only one plot. When a double-headed arrow appears, shown in Figure 1-11, click and drag the border of the plot legend to add one item to the legend. When you release the mouse button, the second plot name appears.


Right-click the waveform graph and select Properties from the shortcut menu to display the Graph Properties dialog box. On the Plots page, select Sawtooth from the top pull-down menu. In the Colors section, click the Line color box to display the color picker. Select a new line color


Select Sawtooth (Formula Result) from the top pull-down menu. Place a checkmark in the Do not use waveform names for plot names checkbox. This action lets you edit the labels on the graph.


In the Name text box, delete the current label and change the name of this plot to Scaled Sawtooth.
Click the OK button to save the current configuration and close the Graph Properties dialog box


 Right-click the waveform graph and select Properties from the shortcut menu to display the Graph Properties dialog box. On the Plots page, select Sawtooth from the top pull-down menu. In the Colors section, click the Line color box to display the color picker. Select a new line color.


TASK 1 FOR LABVIEW CHAPTER 1

Hi Assalammualaikum today our lecturer has given to us a task regarding chapter 1 labView So, here we gooooooooooo The task is about 1....